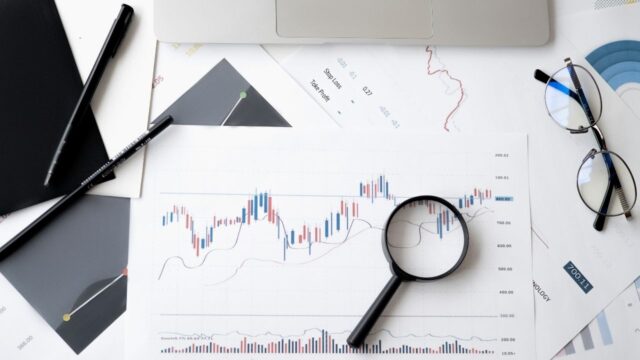
Technical Analysis
Technical analysis is a way to analyze stocks. The term refers to the study of market that is based on the action and movement of the market price. The understanding of the study is derived through price charts that indicate relevant forecasting based on the trading history, statistics, and market trends. Therefore, technical analysis takes into account the recent and past prices, actual price behavior, and other relevant factors that help the investor.
Financial analyst and professionals make use of technical analysis majorly in the foreign exchange market to analyze securities. In other terms, technical analysis studies the demand and supply of the market which helps in evaluating the market trends.
How does this work?
In order to carry out technical analysis, the investors start by understanding the charts and figures related to the history of the trading volume for an index or security. Besides these, various statistical measures (percentage changes, minimums, maximums and averages) are also taken into consideration.
Assumptions of technical analysis:
- The market is cyclic. History will repeat itself
- The market trends determine the prices
- The market is discounted
Characteristics of technical analysis:
- First, it employs the rule for trading based on the business cycle, volume and price, regressions, averages and other indicators.
- Second, when technical analysis determines the price, volume and other similarities, it also takes into account other facts including company, currency, commodity, and the market.
- Mostly used by traders, in particular the active day traders, market makers, and pit traders
Key indicators of technical analysis:
These indicators are commonly used in the process of technical analysis which also works as ‘buy or sell’ signals in the stock/trading market.
- Moving Average Convergence Divergence (MACD)
- On-Balance Volume
- Average Directional Index
- Aroon Indicator
- Relative strength Index
Why is technical analysis important?
These are unlike the fundamental analysis that is based on finding true value of a security through the study of macroeconomic event, competition, financial statements, etc.
Technical analysis is more focused on predicting the future market and individual stocks by analyzing the past market trends. When the investor successfully interprets graph readings and accordingly predict the movement of the stock, chances are that he or she will make a lot of good money.
How to read charts
For many people, charts can be daunting. All those lines and squiggles can appear to be nothing more than a jumble of random data. However, there is actually a lot of information that can be gleaned from charts, especially if you know how to read them. One of the most important things to understand is technical analysis. This is the study of past market data in order to identify patterns and trends. By understanding technical analysis, you can begin to make predictions about where the market is headed and make better investment decisions. There are many different resources available to help you learn technical analysis, so don’t be afraid to do some research and learn how to read charts like a pro.
Trading strategies
Technical analysis is a trading strategy that relies on analyzing past market data to identify patterns and make predictions about future price movements. Traders who use technical analysis believe that prices move in predictable patterns and that these patterns can be used to profit from trading.
Technical analysis is a widely used approach among professional traders and is often combined with other strategies, such as fundamental analysis. While technical analysis can be used to trade any financial instrument, it is most commonly applied to the forex market. One of the key advantages of technical analysis is that it can be used to trade both long-term and short-term positions.
For example, technical traders may choose to enter a long-term position when they identify a bullish trend and then use technical indicators to time their exit from the trade. In contrast, technical traders may also day trade, entering and exiting positions multiple times within the same day. Technical analysis can be a useful tool for traders of all experience levels.
However, it is important to remember that technical analysis is not an exact science and that prices can move in unpredictable ways. As such, technical traders should always use risk management techniques, such as stop-losses, to protect themselves from potentially large losses.


